NorESM2 SSPs
Contents
NorESM2 SSPs#
Detailed information about the simulations can be found by clicking on case names in the table of contents or at the bottom of this page
Future scenarios#
Representative Concentration Pathways#
RCPs: Representative Concentration Pathways are future projections of atmospheric greenhouse gas concentrations and subsequent radiative forcing. The number after RCP represent the radiative forcing by year 2100.
RCP2.6: radiative forcing peaks at ~3W/m2 before year 2100 and then declines
RCP4.5: radiative forcing stabilises at approximately 4.5 W/m2 after year 2100
RCP7.0: radiative forcing stabilises at approximately 7.0 W/m2 after year 2100
RCP8.5: radiative forcing reaches greater than 8.5W/m2 by year 2100
The forcing used in CMIP6 for future projections are combinations of SSPs and RCPs.
For a brief description, also see https://www.carbonbrief.org/explainer-how-shared-socioeconomic-pathways-explore-future-climate-change
For an overview and description of the various CMIP6 experiments, please see: https://search.es-doc.org/
SSP-based RCP scenarios:#
SSP1-2.6: SSP-based RCP scenario with low radiative forcing by the end of the century. Following approximately RCP2.6 global forcing pathway with SSP1 socioeconomic conditions. Radiative forcing reaches a level of 2.6 W/m2 in 2100. Concentration-driven. The scenario represents the low end of the range of plausible future pathways. The scenario depicts the “best case” future from the sustainability perspective.
SSP2-4.5: SSP-based RCP scenario with medium radiative forcing by the end of the century. Following approximately RCP4.5 global forcing pathway with SSP2 socioeconomic conditions. Radiative forcing reaches a level of 4.5 W/m2 in 2100. Concentration-driven. The scenario represents the medium part of the range of plausible future pathways.
SSP3-7.0: Baseline scenario with a medium to high radiative forcing by the end of century. Following approximately RCP7.0 global forcing pathway with SSP3 socioeconomic conditions. Radiative forcing reaches a level of 7.0 W/m2 in 2100. Concentration-driven. The scenario represents the medium to high end of plausible future pathways. SSP3-7.0 fills a gap in the CMIP5 forcing pathways that is particularly important because it represents a forcing level common to several (unmitigated) SSP baselines.
SSP5-8.5: SSP-based RCP scenario with high radiative forcing by the end of century. Following approximately RCP8.5 global forcing pathway with SSP5 socioeconomic conditions. Concentration-driven. The scenario represents the high end of plausible future pathways. SSP5 is the only SSP with emissions high enough to produce the 8.5 W/m2 level of forcing in 2100.
A quick overview#
NorESM2-MM future scenario experiments#
Case name |
Simulation time (y) |
|---|---|
NSSP126frc2_f09_tn14_20191105 |
2015 - 2100 |
NSSP245frc2_f09_tn14_20191105 |
2015 - 2100 |
NSSP245frc2_02_f09_tn14_20200629 |
2015 - 2100 |
NSSP245frc2_03_f09_tn14_20200630 |
2015 - 2020 |
NSSP370frc2_f09_tn14_20191105 |
2015 - 2100 |
NSSP585frc2_f09_tn14_20191105 |
2015 - 2100 |
NSSP585frc2_f09_tn14_20200919 |
2015 - 2100 |
Please note that the two SSP585 cases are bit-identical but with different output. These should not be treated as 2 ensemble members.
NorESM2-LM future scenario experiments#
Case name |
Simulation time (y) |
|---|---|
NSSP126frc2_f19_tn14_20191014 |
2015 - 2100 |
NSSP245frc2_f19_tn14_20191014 |
2015 - 2100 |
NSSP245frc2_02_f19_tn14_20191014 |
2015 - 2100 |
NSSP245frc2_03_f19_tn14_20191014 |
2015 - 2100 |
NSSP370frc2_f19_tn14_20191014 |
2015 - 2100 |
NSSP370frc2_02_f19_tn14_20191118 |
2015 - 2100 |
NSSP370frc2_03_f19_tn14_20191118 |
2015 - 2100 |
NSSP585frc2_f19_tn14_20191014 |
2015 - 2059 |
NorESM2-LM SSP2-4.5, aerosol and oxidants only#
From CMIP6 es-doc: An extension of at least one of the hist-aer (histAER) simulations to the year 2100 following SSP2-4.5 aerosol concentrations. Forced with aerosol and aerosol precursor emissions only (sulfate, black carbon, organic carbon, ammonia, NOx and VOCs).
Case name |
Simulation time (y) |
|---|---|
NSSP245frc2aeroxidonly_f19_tn14_20191015 |
2015 - 2020 |
NSSP245frc2aeroxidonly_02_f19_tn14_20191015 |
2015 - 2020 |
NSSP245frc2aeroxidonly_03_f19_tn14_20191015 |
2015 - 2020 |
NorESM2-LM SSP2-4.5, natural-only#
From CMIP6 es-doc: An extension of at least one of the hist-nat (histNAT) simulations to the year 2100 following SSP2-45 solar and volcanic forcing. The future solar forcing data recommended for CMIP6 has a downward trend (Matthes et al., 2016).
Case name |
Simulation time (y) |
|---|---|
NSSP245frc2natonly_f19_tn14_20191015 |
2015 - 2020 |
NSSP245frc2natonly_02_f19_tn14_20191015 |
2015 - 2020 |
NSSP245frc2natonly_03_f19_tn14_20191015 |
2015 - 2020 |
NorESM2-LM, scenario SSP3-7.0-lowNTCF both for GHGs and aerosol emissions.#
lowNTCF = reduced Near Term Climate Forcer (NTCF) emissions.
From CMIP6 es-doc: SSP-based RCP scenario following approximately RCP7.0 global forcing pathway but with reduced Near Term Climate Forcer (NTCF) emissions. SSP3 socioeconomic conditions.
Case name |
Simulation time (y) |
|---|---|
NSSP370LOWNTCFfrc2_f19_tn14_20191118 |
2015 - 2100 |
NSSP370LOWNTCFfrc2_02_f19_tn14_20191118 |
2015 - 2100 |
NSSP370LOWNTCFfrc2_03_f19_tn14_20191118 |
2015 - 2100 |
NorESM2-LM SSP3-7.0, with SSP3-7.0 GHG and low NTCF emissions#
These scenarios have greenhouse gas concentrations from SSP3-7.0 (therefore REFGHG in name), but aerosol emissions from SSP3-7.0-lowNTCF (see description above).
Case name |
Simulation time (y) |
|---|---|
NSSP370REFGHGLOWNTCFfrc2_f19_tn14_20191220 |
2015 - 2059 |
NSSP370REFGHGLOWNTCFfrc2_02_f19_tn14_20191220 |
2015 - 2059 |
NSSP370REFGHGLOWNTCFfrc2_03_f19_tn14_20191220 |
2015 - 2059 |
NorESM2-LM SSP5-8.5, emission-driven#
From CMIP6 es-doc: Emission driven future scenario (SSP-based RCP SSP5-8.5) up to 2100. Starting conditions taken from emissions-driven Historical simulation. For analysis of impact of carbon cycle feedbacks on climate projections over the 21st century, and for assessment of cumulative emissions compatible with climate targets.
Case name |
Simulation time (y) |
|---|---|
NSSP585_f19_tn14_20191223esm |
2015 - 2100 |
Time series of NorESM2-LM Scenario experiments#
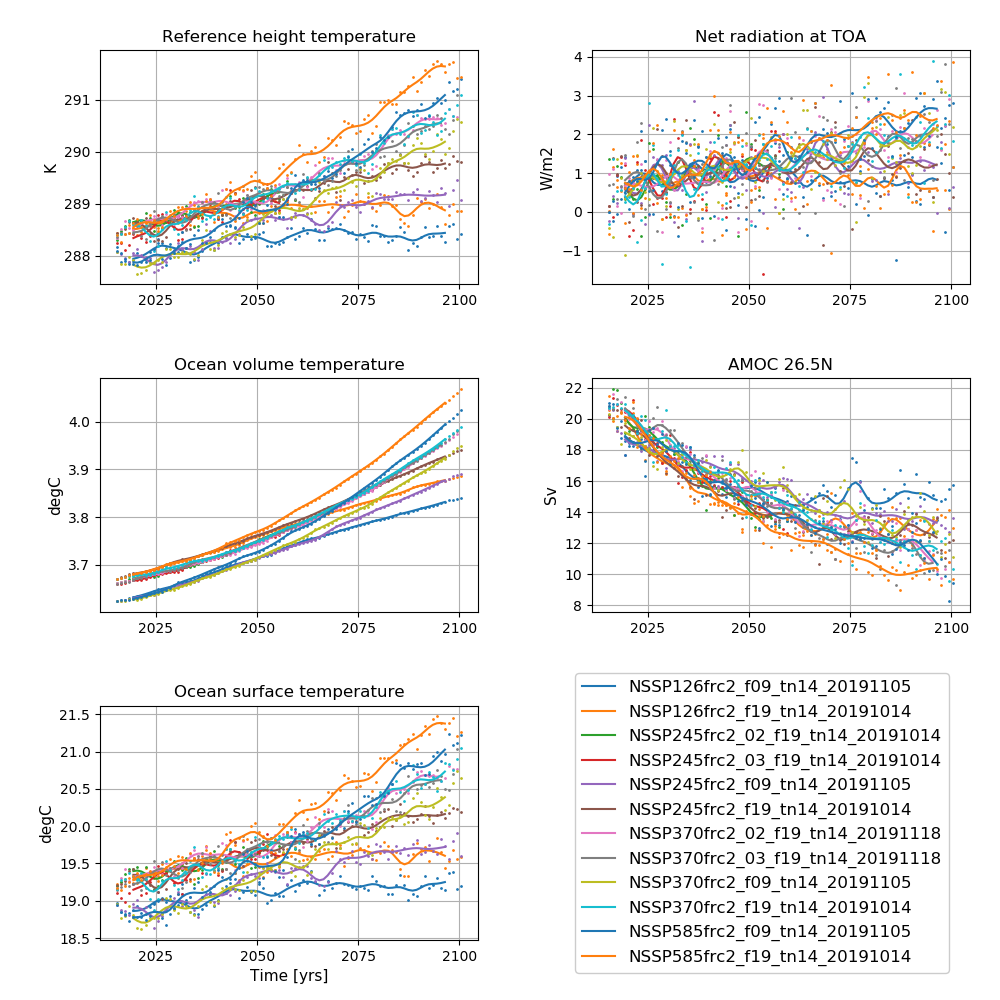 NorESM2-LM SSP simulations
Left column (from top to bottom): Globally and annually averaged Surface (2m) air temperature, global and volume averaged ocean temperature, Sea surface temperature (SST).
Right column (from top to bottom): Globally and annually averaged Net radiation @ top of model, Atlantic meridional overturning circulation (AMOC) @ 26.5N. The figure shows annual average (dots) and 5-year moving average (solid line).
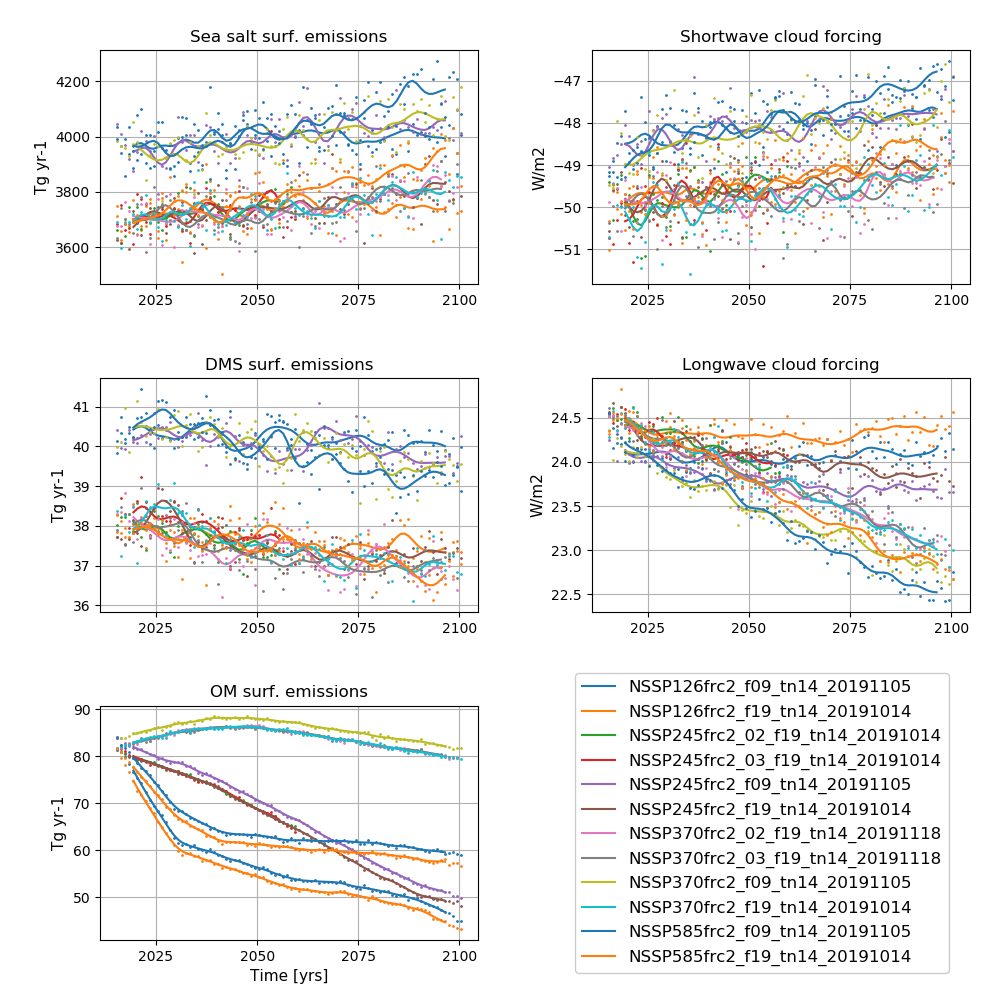 NorESM2-LM SSP simulations
Left column (from top to bottom): Globally and annually sum of Sea salt surface emissions, DMS (dimethylsulfide) surface emissions, POM (primary organic matter) surface emissions.
Right column (from top to bottom): Globally and annually averaged shortwave cloud forcing and longwave cloud forcing.
The figure shows annual average (dots) and 5-year moving average (solid line).