NorESM2-LM 1pctCO2
Contents
NorESM2-LM 1pctCO2#
Data storage#
All data are CMOR-ized and public available here: https://esg-dn1.nsc.liu.se/search/cmip6-liu/
All raw data from NorESM2-LM DECK simulations are stored on NIRD @ sigma2 under:
/projects/NS9560K/noresm/cases/
The NorESM2-LM 1 percent per year increase in the atmospheric CO2 concentration, 1pctCO2, simulations cover the years 1 - 165
N1PCT_f19_tn14_20190626 (1 - 120)
N1PCT_f19_tn14_20190712 (121 - 165, extra output)
The cmorized data can be accessed on NIRD @ sigma2 under:
/projects/NS9034K/CMIP6/CMIP/NCC/NorESM2-LM/1pctCO2/r1i1p1f1/
Simulation specifics#
N1PCT_f19_tn14_20190626 (1 - 120)#
CESM parent |
CESM2.1.0 |
Parent |
N1850_f19_tn14_11062019 |
Run type |
hybrid |
Branch time from parent |
1600-01-01 |
Simulated years |
01-01-0001 - 31-12-120 |
Compset |
1850_CAM60%NORESM%1PCT_CLM50%BGC-CROP_CICE%NORESM-CMIP6_MICOM%ECO_MOSART_SGLC_SWAV_BGC%BDRDDMS |
Git branch |
featureCESM2.1.0-OsloDevelopment |
Git commit |
71c9a6c |
Resolution |
f19_tn14 |
Machine |
Fram |
Case folder |
/cluster/projects/nn2345k/oyvinds/NorESM2_CMIP6/cases/N1PCT_f19_tn14_20190626 |
Diagnostics |
http://ns2345k.web.sigma2.no/diagnostics/noresm/common/N1PCT_f19_tn14_20190626/ |
N1PCT_f19_tn14_20190712 (121 - 165, extra output)#
CESM parent |
CESM2.1.0 |
Parent |
N1PCT_f19_tn14_20190626 |
Run type |
branch |
Branch time from parent |
0121-01-01 |
Simulated years |
01-01-0121 - 31-12-165 |
Compset |
1850_CAM60%NORESM%1PCT_CLM50%BGC-CROP_CICE%NORESM-CMIP6_MICOM%ECO_MOSART_SGLC_SWAV_BGC%BDRDDMS |
Git branch |
featureCESM2.1.0-OsloDevelopment |
Git commit |
e2c861c |
Resolution |
f19_tn14 |
Machine |
Fram |
Case folder |
/cluster/projects/nn2345k/olivie/cases-cmip6/N1PCT_f19_tn14_20190712 |
Diagnostics |
http://ns2345k.web.sigma2.no/diagnostics/noresm/common/N1PCT_f19_tn14_20190712/ |
Time series of NorESM2-LM 1% increase of atmospheric CO2 concentration experiments#
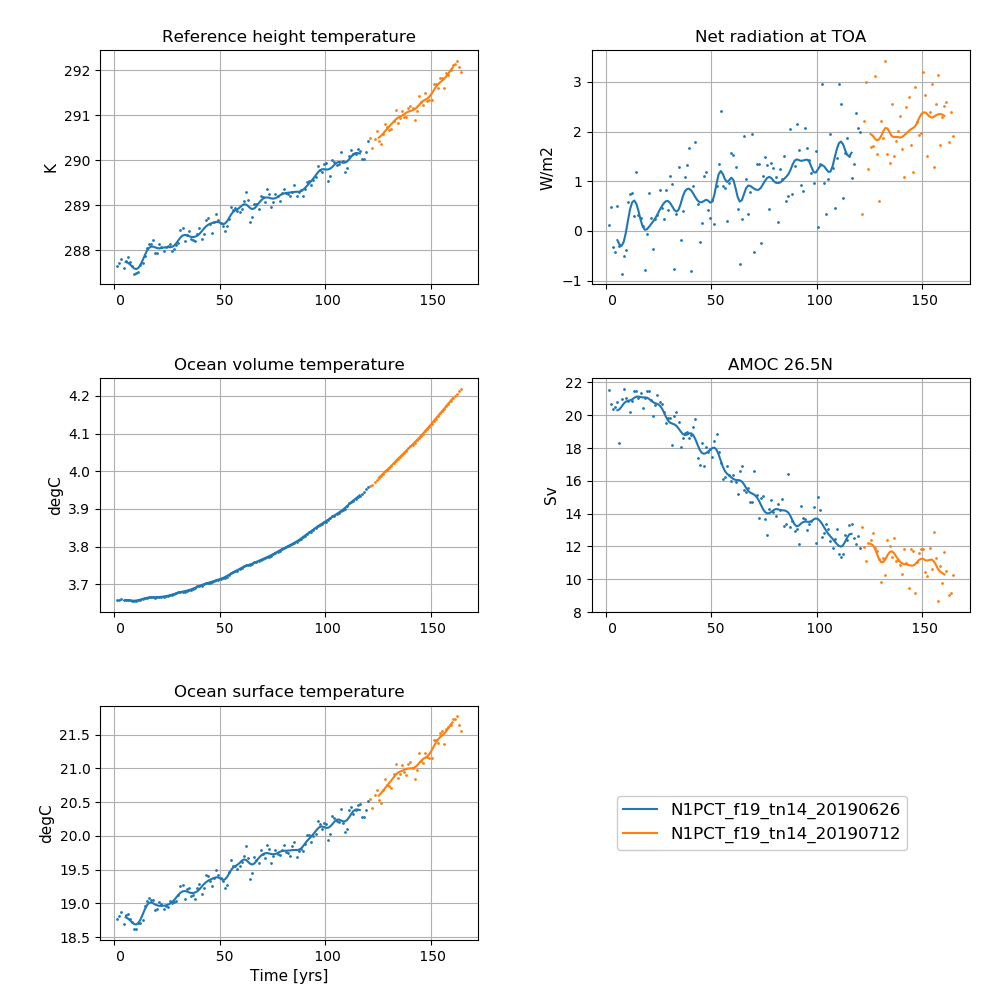 NorESM2-LM 1pctCO2 simulations
Left column (from top to bottom): Globally and annually averaged Surface (2m) air temperature, global and volume averaged ocean temperature, Sea surface temperature (SST).
Right column (from top to bottom): Globally and annually Globally and annually averaged Net radiation @ top of model, Atlantic meridional overturning circulation (AMOC) @ 26.5N.
The figure shows annual average (dots) and 5-year moving average (solid line).
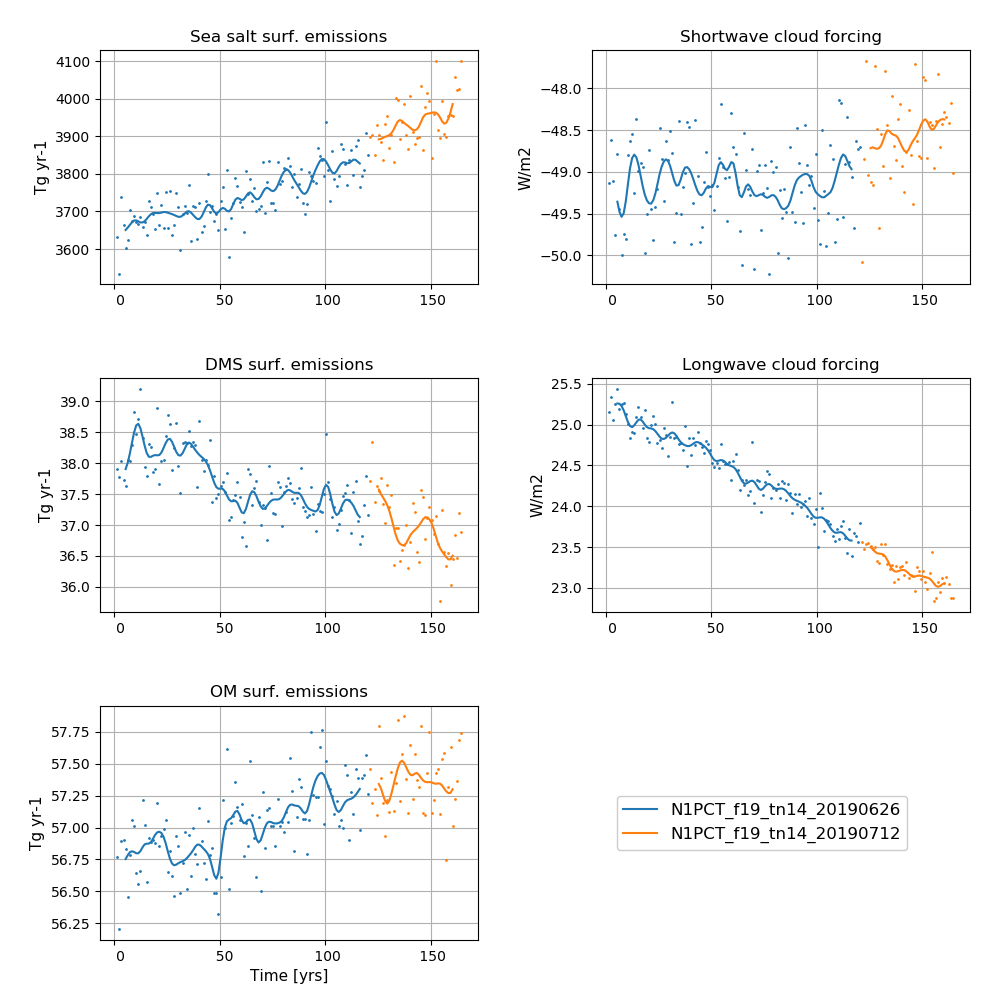 NorESM2-LM 1pctCO2 simulations
Left column (from top to bottom): Globally and annually sum of Sea salt surface emissions, DMS (dimethylsulfide) surface emissions, POM (primary organic matter) surface emissions.
Right column (from top to bottom): Globally and annually averaged shortwave cloud forcing and longwave cloud forcing.
The figure shows annual average (dots) and 5-year moving average (solid line).