NorESM2-LM DECK
Contents
NorESM2-LM DECK#
Detailed information about the simulations can be found by clicking on case names in the table of contents or at the bottom of this page
A quick overview#
piControl#
Case name |
branch time (y-m-d) |
Simulation time (y) |
|---|---|---|
N1850_f19_tn14_20190621 |
- |
1600 - 1800 |
N1850_f19_tn14_20190722 |
1801-01-01 |
1801 - 1900 |
N1850_f19_tn14_20190802 |
1900-01-01 |
1901 - 1999 |
abrupt-4xCO2#
Case name |
branch time (y-m-d) |
Simulation time (y) |
|---|---|---|
NCO2x4_f19_tn14_20190624 |
- |
1 - 140 |
NCO2x4_f19_tn14_20190705 |
0121-01-01 |
121 - 150 |
NCO2x4_f19_tn14_20190724 |
0151-01-01 |
151 - 500 |
NCO2x4_f19_tn14_20191129 |
0501-01-01 |
501 - 620 |
1pctCO2#
Case name |
branch time (y-m-d) |
Simulation time (y) |
|---|---|---|
N1PCT_f19_tn14_20190626 |
- |
1 - 120 |
N1PCT_f19_tn14_20190712 |
0121-01-01 |
121 - 165 |
AMIP#
Case name |
branch time (y-m-d) |
Simulation time (y) |
|---|---|---|
NFHISTnorpddmsbc_f19_mg17_20191025 |
- |
1975 - 2014 |
for AMIP details, please see NorESM2-LM historical
Time series of NorESM2-LM DECK experiments#
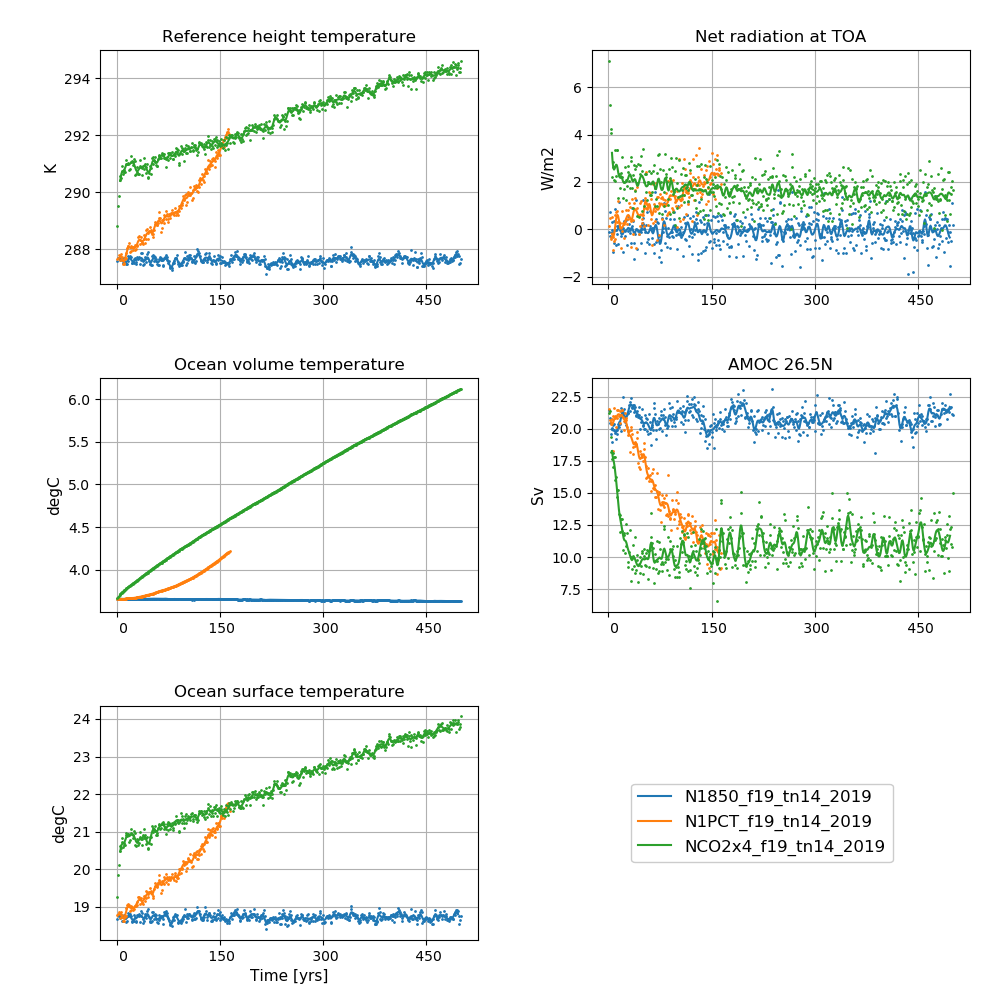 NorESM2-LM DECK simulations
Left column (from top to bottom): Globally and annually averaged Surface (2m) air temperature, global and volume averaged ocean temperature, Sea surface temperature (SST). Right column (from top to bottom): Globally and annually Globally and annually averaged Net radiation @ top of model, Atlantic meridional overturning circulation (AMOC) @ 26.5N.
The figure shows annual average (dots) and 5-year moving average (solid line).
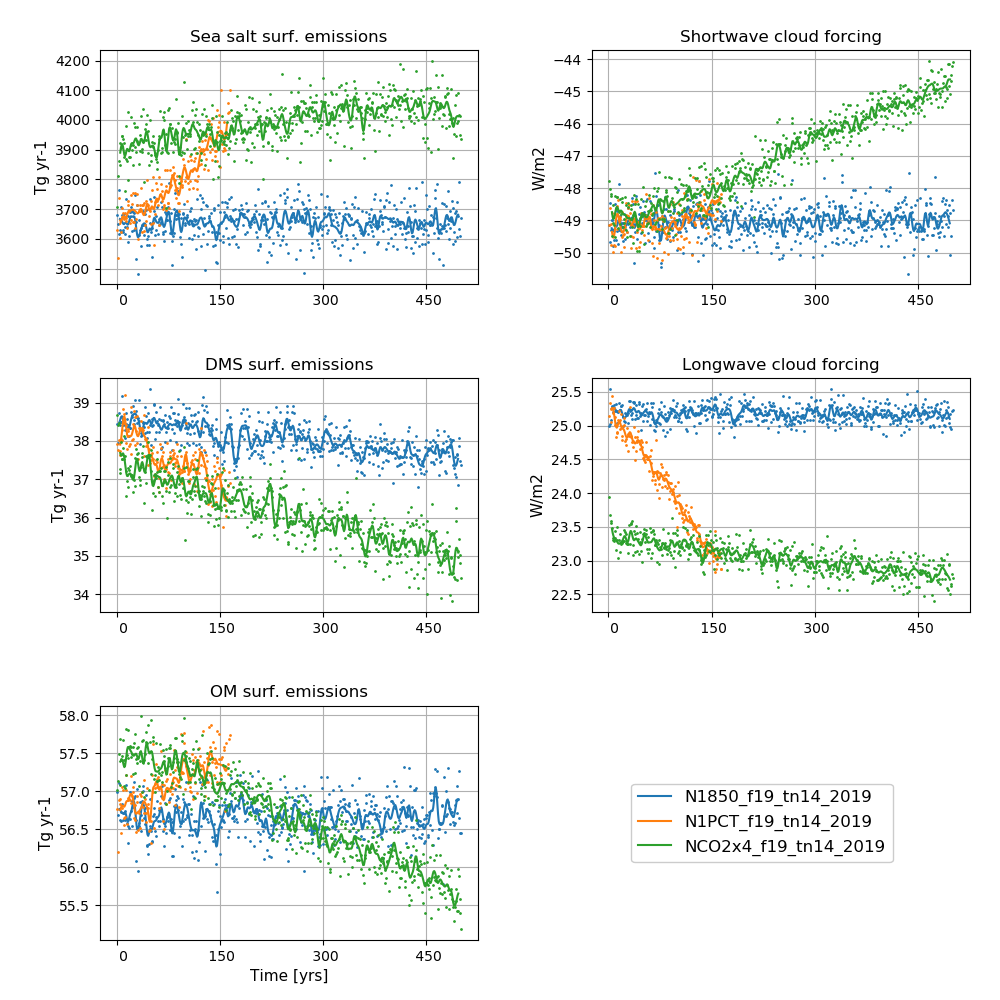 NorESM2-LM DECK simulations
Left column (from top to bottom): Globally and annually sum of Sea salt surface emissions, DMS (dimethylsulfide) surface emissions, POM (primary organic matter) surface emissions. Right column (from top to bottom): Globally and annually averaged shortwave cloud forcing and longwave cloud forcing.
The figure shows annual average (dots) and 5-year moving average (solid line).