NorESM2 historical
Contents
NorESM2 historical#
Detailed information about the simulations can be found by clicking on case names in the table of contents or at the bottom of this page
A quick overview#
NorESM2 historical experiments: all-forcing simulation of the recent past; 1850 - 2014
NorESM2-MM fully coupled historical experiments#
Ensemble member 1#
Case name |
Simulation time (y) |
|---|---|
NHISTfrc2_f09_tn14_20191001 |
1850 - 1949 |
NHISTfrc2_f09_tn14_20191025 |
1950 - 2014 |
Ensemble member 2#
Case name |
Simulation time (y) |
|---|---|
NHISTfrc2_02_f09_tn14_20200427 |
1850 - 1949 |
NHISTfrc2_02_f09_tn14_20200519 |
1950 - 2014 |
Ensemble member 3#
Case name |
Simulation time (y) |
|---|---|
NHISTfrc2_03_f09_tn14_20200519 |
1850 - 1949 |
NHISTfrc2_03_f09_tn14_20200619 |
1950 - 2014 |
NorESM2-MM AMIP historical experiment#
Case name |
Simulation time (y) |
|---|---|
NFHISTfrc2_f09_mg17_20191107 (DECK) |
1975 - 2012 |
NorESM2-LM fully coupled historical experiments#
Ensemble member 1#
Case name |
Simulation time (y) |
|---|---|
NHIST_f19_tn14_20190625 |
1850 - 1949 |
NHIST_f19_tn14_20190710 |
1950 - 2014 |
Ensemble member 2#
Case name |
Simulation time (y) |
|---|---|
NHIST_02_f19_tn14_20190801 |
1850 - 1949 |
NHIST_02_f19_tn14_20190813 |
1950 - 2014 |
Ensemble member 3#
Case name |
Simulation time (y) |
|---|---|
NHIST_03_f19_tn14_20190801 |
1850 - 1949 |
NHIST_03_f19_tn14_20190813 |
1950 - 2014 |
NorESM2-LM AMIP historical experiments#
Case name |
Simulation time (y) |
|---|---|
NFHISTnorpddmsbc_f19_mg17_20191025 (DECK) |
1975 - 2014 |
NFHISTnorbc_f19_20191107 |
1850 - 2014 |
NFHISTnorbc_f19_20190730 |
1850 - 2014 |
Time series of NorESM2-MM historical experiments#
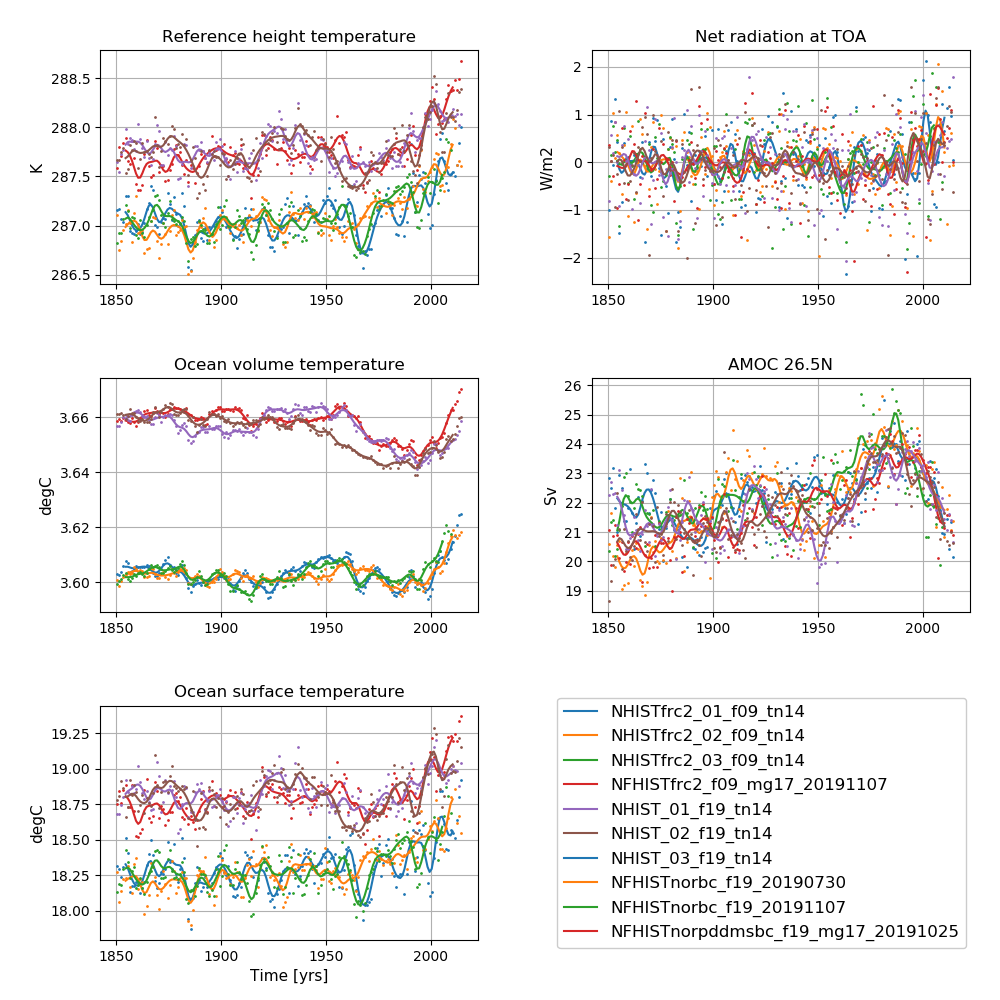 NorESM2 historical simulations
Left column (from top to bottom): Globally and annually averaged Surface (2m) air temperature, global and volume averaged ocean temperature, Sea surface temperature (SST).
Right column (from top to bottom): Globally and annually averaged Net radiation @ top of model, Atlantic meridional overturning circulation (AMOC) @ 26.5N.
The figure shows annual average (dots) and 5-year moving average (solid line).
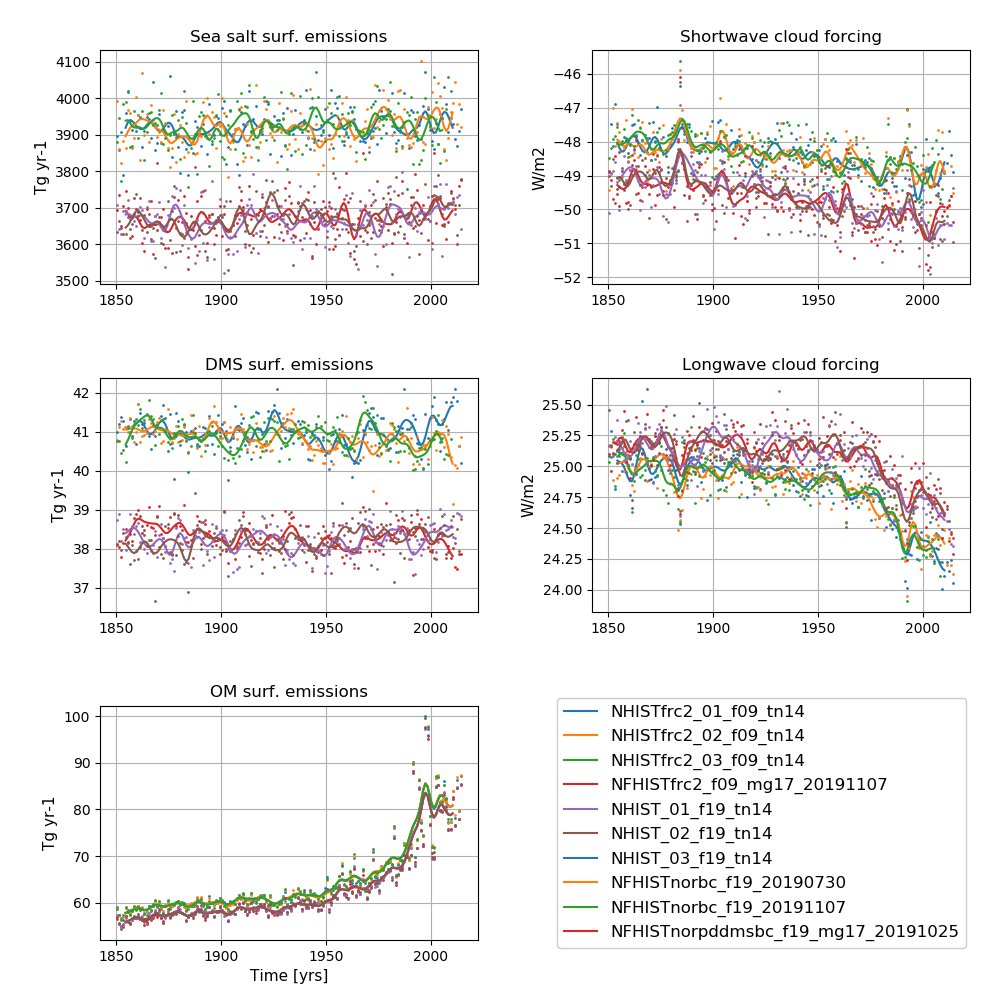 NorESM2 historical simulations
Left column (from top to bottom): Globally and annually sum of Sea salt surface emissions, DMS (dimethylsulfide) surface emissions, POM (primary organic matter) surface emissions.
Right column (from top to bottom): Globally and annually averaged shortwave cloud forcing and longwave cloud forcing.
The figure shows annual average (dots) and 5-year moving average (solid line).